Speed to Lead Statistics: Every Study, Checked (2026)
Every speed to lead statistic traced to its study, with its sample and segment marked, and what the numbers mean now that AI can answer a lead in minutes.

In this article
Every deck that argues for faster speed to lead has a slide that says leads go cold in five minutes, and every deck credits it to someone different: Harvard, MIT, a vendor’s blog. Most speed to lead statistics are three or four studies, recycled without their method. Here is each one with who measured it, when, on what sample and what it actually counted, checked in October 2026.
- ⅔In a 2026 test, AI agents filled in 6,346 B2B demo and contact forms. "Two-thirds of companies never replied." And "5% of replies arrived within five minutes."1
- 100×In the 2007 Lead Response Management study, InsideSales.com and James Oldroyd found the odds of contacting a lead increase 100 times if attempted within five minutes versus 30 minutes.2
- 80%A 2025 survey of more than 4,000 B2B buyers found "the vendor buyers prefer before engaging with sellers still wins 80% of deals."3
Read with their method, the studies still say speed matters, and what it is for: earning a conversation. None of them measured closed deals.
Jump to what you need:
- Table Every figure, checked
- Check Five questions before the deck
- 2007 Where five minutes comes from
- Stop Figures to retire
- Test Measure your own
What are the statistics for lead response time?
The checked statistics fall into three groups. Audits of companies today show most respond slowly or never.1, 4 The origin research shows the odds of contact and qualification fall within minutes.2 Buyer surveys show buyers contact vendors late and usually buy from their favourite.3
Read the “Counted” column before you quote a row. A reply, a phone contact, a qualified lead and a closed deal are four different things.
Speed to lead statistics, checked
Last checked October 2026. Every row is B2B unless it says otherwise. The marked row is the one most often misquoted.
| Figure | Source and sample | Counted | Use it? |
|---|---|---|---|
| Companies today | |||
| Two-thirds of companies never replied | Clay, 2026: 6,346 demo and contact forms, filled in by AI agents | Whether a reply arrived | With caveat Vendor experiment; run dates not stated |
| 5% of replies arrived within five minutes | Clay, 2026: same test | Time to first reply | With caveat Vendor experiment |
| 96% of companies never phoned | Clay, 2026: same test | Whether a call came | With caveat Vendor experiment |
| Average response 15 to 24 hours; 26 to 40 hours for human replies only | Clay, 2026: same test | Time to first reply | With caveat Vendor experiment |
| More than 99% didn't respond within five minutes; 1 of 114 sent a personalised email within five minutes | Workato, study about 2022 (page dated 2026): demo requests to 114 companies | Time to first reply, by channel | With caveat Small; older than its page date |
| Average email reply 11 hours 54 minutes; 31% responded by phone | Workato, about 2022: same 114 companies | Email reply time; whether a call came | With caveat Small; older |
| The origin research | |||
| Contact odds 100 times higher at five minutes than at 30 | InsideSales.com with James Oldroyd (then MIT), Lead Response Management study, 2007: six companies, three years, 15,000+ web leads, 100,000+ call attempts. Segment not stated; examples were mortgage and insurance | Phone contact: a live call lasting a set length | With caveat Say "phone contact", not "response" or "sales" |
| Qualification odds 21 times higher at five minutes than at 30 | Same study, 2007; segment not stated | Qualification: willing to enter the sales process | With caveat Not closed deals |
| Contact odds fall more than 10 times across the first hour; qualification odds more than 6 times | Same study, 2007; segment not stated | Phone contact and qualification | With caveat Phone only |
| Most companies are not responding nearly fast enough | Oldroyd, McElheran and Elkington, Harvard Business Review, March 2011; sample and segment not stated in the abstract | Response speed to online leads | Quote no figure Abstract read; full text not checked |
| Buyers today | |||
| The vendor preferred before engaging sellers wins 80% of deals | 6sense, 2025 press release (Nov 2025): more than 4,000 buyers, North America, EMEA and APAC | Who won, by preference before first contact | With caveat Vendor survey |
| First contact about 61% of the way through the journey (down from 69%); buyers initiated 79% of engagements | 6sense, 2025 report page: nearly 4,000 responses, plus a 766-response supplement | When and by whom first contact was made | With caveat Vendor survey |
| Research-to-seller time moved from 70/30 to 60/40 | 6sense, 2025 press release (Nov 2025): more than 4,000 buyers | Share of the journey spent with sellers | With caveat Vendor survey |
| After hours | |||
| A 23% rise in weekend traffic from C-suite and VP-of-sales visitors | DesignRush, 2024, reported by MediaPost; sample not stated in the report we read | Website visits, not leads | Weak No baseline stated |
| Historical: Drift's lead response surveys | |||
| 7% responded within five minutes; 55% didn't respond within five business days | Drift, 2017: 433 B2B SaaS company websites, secret-shopper test | Time to first reply | Historical Cite as "Drift found in 2017" |
| 58% never responded; 10% responded within five minutes | Drift, 2018: 512 B2B companies, five-day window | Time to first reply | Historical Cite with the year |
| 53% said sales took two to 24 hours or more to follow up | Drift and CustomerGauge, 2020: survey of 100+ B2B businesses | Self-reported follow-up time | Historical Self-reported, not timed |
| Repeated with no named study | |||
| 52% of leads arrive after hours | No named study; sample and segment unknown | Unknown | Avoid Count your own leads by hour |
| 80% of sales need five or more follow-ups | No named study; sample and segment unknown | Unknown | Avoid No study we could trace |
| 44% of reps give up after one follow-up | No named study; sample and segment unknown | Unknown | Avoid No study we could trace |
How we checked each figure
Clay, 2026. The largest recent audit we found, by number of forms; a vendor’s own experiment with no run dates stated. Cite it as Clay’s, with the year.
Workato. The page carries a 2026 date, but the study is older and small. Supporting evidence, not the headline.
Lead Response Management study, 2007. Presented in October 2007 at a MarketingSherpa B2B demand generation summit by Oldroyd and Dave Elkington, then CEO of InsideSales.com, from InsideSales.com’s own system data. Only web-form leads called at least once; every response was a phone call. A contact was a live call lasting a set length, and a lead was qualified when willing to enter the sales process, sometimes by setting an appointment, each as each company defined it. It did not address close ratios.
HBR, 2011. We read the abstract. Secondhand summaries quote figures from it in hours, not minutes; we haven’t read the full text to check them, so we don’t quote them, and you shouldn’t until you have.
6sense, 2025. Vendor research (6sense sells account-based marketing and intent data), and the largest recent survey we found on when buyers make contact. The press release says more than 4,000 buyers; the report page says nearly 4,000 responses plus a 766-response supplement, so the table names the source of each figure.
Drift, 2017 to 2020. Six to nine years old, from a vendor that sold a fix: history.
Our own numbers are not audited, so they stay out of the table and are labelled in the last section.
How to check a speed to lead statistic before you put it in a deck
Five questions settle it. Who measured it? When? How many companies or buyers? B2B or B2C? And what exactly was counted: a reply, a contact, a qualified lead, a meeting or revenue? If you can answer all five, write them into the source line. If you can’t, leave the figure off the slide.
Here it is run on two figures:
| Ask | A: "Contact odds 100x higher at 5 minutes than 30" | B: "52% of leads arrive after hours", repeated with no named study |
|---|---|---|
| 1. Who measured it? | ✓ InsideSales.com with James Oldroyd | ✗ No named study |
| 2. When? | ✓ 2007, from three years of data | ✗ Unknown |
| 3. How many? | ✓ Six companies, 15,000+ web leads | ✗ Unknown |
| 4. B2B or B2C? | ? Not stated: examples were mortgage and insurance | ✗ Unknown |
| 5. What was counted? | ✓ Phone contact, not sales | ✗ Unknown |
| Verdict | Use it, with the caveat in the source line | Drop it |
Run the check on the 100 times figure and you get a source line you can defend: “Contact odds 100 times higher at five minutes than at 30. Source: InsideSales.com with James Oldroyd, Lead Response Management study, 2007; six companies, 15,000+ web leads; phone contact, not sales.” It’s longer than “Harvard says”. It’s also the version that survives the CFO’s question.
Run it on “52% of leads arrive after hours” and it fails at the first question. That doesn’t mean the true number is low. It means the number on the slide is nobody’s, and yours is one CRM report away.
Where the five-minute rule comes from: the Lead Response Management study and HBR 2011
The five-minute rule is a sales rule of thumb: contact a new online lead within five minutes. It rests on a 2007 study by InsideSales.com with James Oldroyd, then a faculty fellow at MIT, of six companies’ web leads. It reported contact odds about 100 times higher at five minutes than at 30.2 It measured contact and qualification, not sales.
- Contact odds fell 100 times between a call at five minutes and a call at 30.2 From five to ten minutes alone, they fell five times.
- Qualification odds fell 21 times between five and 30 minutes, and four times between five and ten.
- Across the first hour, contact odds fell more than 10 times and qualification odds more than 6 times.2
- After 20 hours, the authors found that every additional dial actually hurt the chance of contacting and qualifying the lead.
Response time mattered more than the best day or time to call; in the authors’ words, its effect “dwarfed them both.” What it timed and what it counted:
- Web form submittedThe lead arrives.
- Rep calls (timed)The study timed the minutes from the form to this call: 5 vs 30 minutes.
- Live contact (counted)A call with a person, lasting a set length.
- Qualified (counted)Willing to enter the sales process.
An auto-reply was not part of the study, though dashboards often stop their clock there, and a closed deal was not measured. The five-minute rule is a finding about conversations. That’s what the five-minute research actually measured, and it’s why an auto-reply in 30 seconds doesn’t meet the rule. On a slide, say “phone contact”, not “response” or “sales”.
Where HBR comes in. In March 2011, Harvard Business Review published “The Short Life of Online Sales Leads” by Oldroyd, Kristina McElheran and David Elkington. Its abstract makes one claim: most companies are not responding to online leads nearly fast enough.5 Because HBR is better known, the five-minute figures have been credited to it for years; even Drift’s 2018 report called five minutes HBR’s time frame. If you cite the 100 times figure, credit it to the 2007 study: “InsideSales.com with James Oldroyd, Lead Response Management study, 2007.”
One more limit before it goes on a board slide: the study doesn’t say what kind of companies the six were. Its own worked examples were mortgage and insurance leads. It’s the most detailed evidence we found on the first minutes, but treat it as unproven for B2B software.
How fast do companies respond to leads in 2026?
Slowly, and often not at all. In a 2026 test of 6,346 B2B demo and contact forms, two-thirds of companies never replied, 5% of replies arrived within five minutes, and 96% never phoned.1 Average response ran 15 to 24 hours. A smaller, older test of 114 B2B companies found the same pattern.4
- 96%"96% of companies never picked up the phone to call."1
- 15–24 h"Average speed to lead was 15 to 24 hours depending on the cut, or 26 to 40 hours for human replies only."1
- 1 of 114"Only 1 of the 114 companies sent a personalized email within 5 minutes."4
That test also found “More than 99% of companies aren’t responding within 5 minutes.”4 The average email reply took “11 hours and 54 minutes” , and “Just 31% of companies responded to leads by phone.”4
Both tests time a reply, and a reply clock stops at the first message, whatever it says. The secret-shopper test below adds a second clock.
When do B2B buyers contact a vendor, and does the first responder win?
Late, and usually with a favourite already chosen. In a 2025 survey of nearly 4,000 B2B buyers, first contact came about 61% of the way through the journey and buyers started 79% of engagements.3 The vendor preferred before engaging sellers won 80% of deals.3 No independent study we found measures whether the first vendor to respond wins.
- 61%The point of first contact moved from 69% of the journey to 61%.3
- 79%Buyers initiated 79% of engagements.3
- 95%Buyers chose from one of the four vendors on their day-one shortlist 95% of the time.3
“The vendor buyers prefer before engaging with sellers still wins 80% of deals.”3 And “The buying journey shifted from a 70/30 to 60/40 split between research and seller engagement.”3 Buyers are spending a little more of the journey with sellers, not less.
So does the first responder win? Here the evidence is thinner than the slides suggest. No independent analyst or academic study from 2024 to 2026 that we could find measures the effect of response time on B2B deals. The causal evidence is still the 2007 study, which stops at contact and qualification, and HBR’s 2011 article, whose full text we couldn’t check.
By the time a buyer fills in your form, most of the race has been run. Speed decides whether the buyer still choosing gets a useful conversation while they’re ready for one. Our reading, not a measured finding: the first useful responder has the edge. The first auto-reply doesn’t.
How many leads arrive after hours?
We couldn’t find a current independent study of B2B after-hours lead volume, and the widely quoted “52% of leads arrive after hours” doesn’t trace to one. The nearest third-party evidence counts weekend website visits, not leads. The reliable number is already in your own CRM: count inbound leads by the hour they were created.
In 2024, an agency directory reported a 23% rise in weekend website traffic from C-suite and VP-of-sales visitors.6 It counted website visits, not leads, and gives no baseline. Buyers clearly research on their own schedule; our guide to leads that arrive after hours covers what to do about it.
Lead response statistics from Drift's research, 2017 to 2020 (historical)
Drift’s lead response surveys are worth reading for the method as much as the numbers. Each one stated its sample and its window in the first paragraph.
- 2017: a secret shopper submitted lead, demo-request and sales-inquiry forms on 433 B2B SaaS company websites. “Only 7% of the 433 companies responded within the first five minutes.”7 “More than half (55%) of the companies did not even respond over the course of five business days.”7
- 2018: 512 B2B companies, with responses tracked over a five-day window. 58% never responded at all, and 10% responded within five minutes.8
- 2020: a Drift and CustomerGauge survey of more than 100 B2B businesses. “53% of respondents said it took between two to 24 hours (or more) for sales to follow up with leads.”9 Self-reported, not timed.
Cite them as history: “Drift found in 2017…”. Don’t line them up against Clay’s 2026 test as a trend; the methods differ.
Speed to lead statistics to stop using
Some fail the first question; others are real but quoted for something they never measured. Retire these:
- “Leads go cold after five minutes, according to Harvard.” The five-minute comparison is from the 2007 InsideSales.com study with Oldroyd, not HBR, and it measured phone contact, not sales.2 Use it with that source line or not at all.
- “80% of sales need five or more follow-ups.” We couldn’t trace it to any study.
- “44% of reps give up after one follow-up.” Same: no study behind it that we could find.
- “52% of leads arrive after hours.” No traceable study. Count your own leads by hour instead.
- “57% of the buying journey is done before a buyer contacts sales.” A real figure, from CEB in 2012, and 14 years old.10 6sense’s 2025 finding, first contact at about 61% of the journey with its sample stated, is the current equivalent.3
- “Buyers do 80% of their research before talking to sales.” Not a measured figure. Use 6sense’s 61% instead.3
- Real estate, mortgage or consumer figures quoted as B2B. A lead for a home loan and a lead for an enterprise platform behave differently. If the sample isn’t B2B, say so on the slide.
Test your own speed to lead: the secret-shopper method
The only speed to lead statistic that settles the argument inside your company is your own. One owner, usually RevOps, submits real enquiries under a test identity your sellers won’t recognise, cleared with the sales lead first and removed from CRM reporting afterwards.
- Pick your entry points.Your demo or contact form, your website chat, your sales phone line, and any others a buyer could use.
- Submit at five times.Weekday morning, weekday evening, Friday night, Saturday afternoon and Sunday evening. The weekday-morning result is the one you already know.
- Ask a real question.Whether you integrate with their CRM, or the price range for their team size. A form with a question in it tests whether anyone reads it.
- Record two clocks.The first reply, of any kind. And the first useful reply: one that answers the question or offers a time to talk. Note the channel of each. A dashboard stops at the first clock.
- Wait five business days.That was Drift's window. Anything later is recorded as no reply; write "none", don't drop the row.
Report every row, not an average: one fast weekday reply can hide four weekend silences. A direct booking stops the useful-reply clock. If the test gets spotted, rerun it in a month with a new identity.
Your CRM tells you what the gap costs. Replace each made-up input with your own:
Put a cost on it (illustrative)
- Inbound demo requests a month
- 200
- Created outside staffed hours
- 80, from your CRM's created-time report
- Meetings per 100 answered within the hour
- 20, from your own CRM
- Meetings per 100 answered next business day
- 10, from your own CRM
- Meetings lost a month
- 80 × (20 − 10) ÷ 100 = 8
Eight meetings is an invented result; the method turns “we should be faster” into a number your sales lead can check. For why it matters and what good looks like, start with speed to lead. For the fixes, step by step, read how to reduce lead response time.
Where should you start this week?
- Rewrite the source line on your own speed to lead slide.Run the five questions; if a figure's only source is a roundup, drop it.
- Count your inbound leads by the hour they were created.It replaces every after-hours figure you can't trace.
- Run the five secret-shopper submissions.Two clocks each, every row reported.
How Synapsa answers in under a minute, at every hour
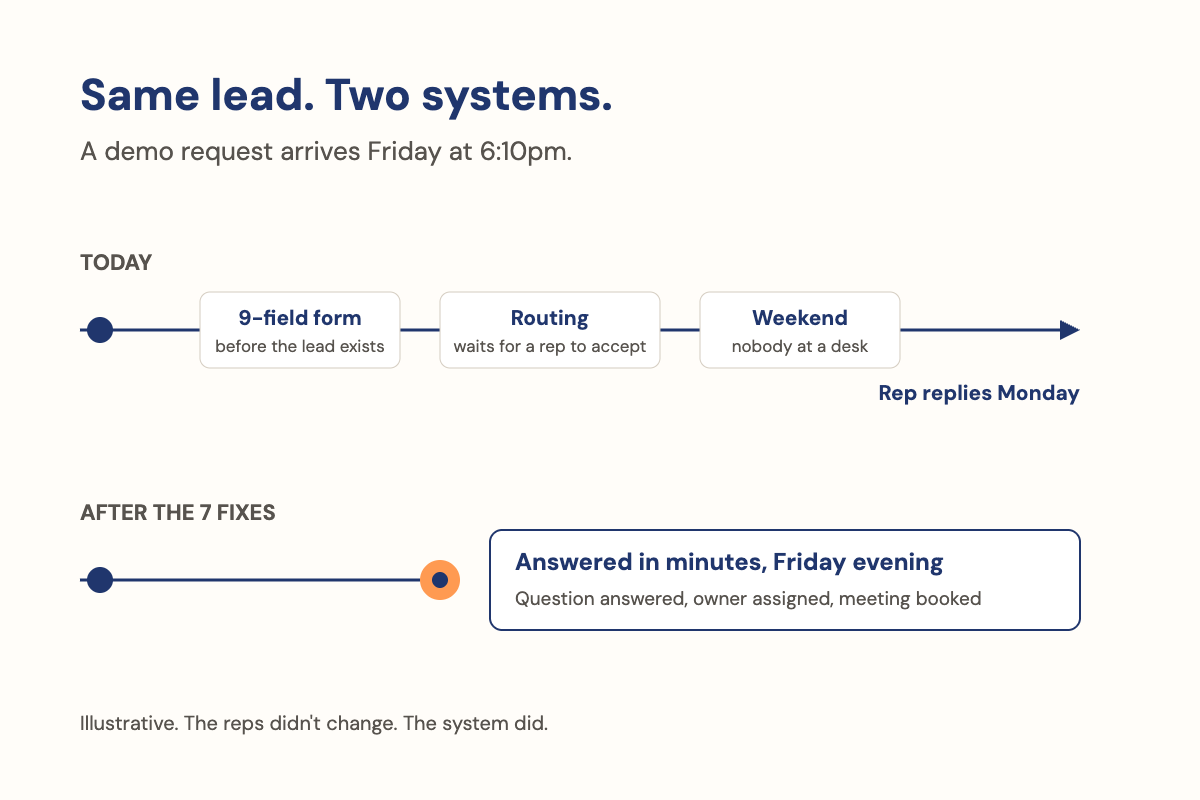
The research counted fast, useful conversations, and most companies still don’t have one waiting at 6pm on a Friday. AI can now do that, and it’s how we built Synapsa. This exchange is illustrative, with a made-up company, but each step is something the product does today.
What goes in. A demo form submitted at 6:12pm on Friday by a RevOps manager at Acme Logistics, with the question typed into the form: “Do you integrate with HubSpot, and can a rep pick up from where your AI left off?” Plus your approved product knowledge, the qualifying questions you set, and your routing rules and calendars.
First message, by SMS: “Hi Sam, thanks for the request. Yes: conversations and booked meetings are logged to HubSpot, so the rep sees what you’ve already said. How many people are on your RevOps and sales team today? That tells me which of our specialists to put you with.” Sam answers “about 40”. The AI routes the request to the mid-market seller who owns that territory and offers three times on Monday; Sam picks 10:30.
The first clock stopped at 6:12pm. So did the second, because the first message answered the question.
Synapsa’s Conversion OS responds when a buyer fills in a form, opens a chat or emails in, across webchat, email, SMS and voice, with memory that carries from one channel to the next. It answers from your approved knowledge, works through discovery and qualification against the objectives you set, routes the buyer to the right seller, meeting type or self-serve next step, and books against your CRM ownership and calendars. When a buyer needs a person, it pauses and alerts the people you name. Speed to lead on the platform is under one minute.11 Reporting today counts conversations engaged, qualified, booked and followed up.
Our own numbers, labelled as ours (from our customer deployments; none is audited):
- In our own data, 44% of inquiries come in after hours, across Synapsa’s customer deployments.11 It is a count of when inquiries arrive, not a survey, and it isn’t split by industry.
- 24+ hours. Average response time to inbound leads before Synapsa, across our customer deployments.11 Our customers came to us because response was a problem, so this describes them before they changed, not the market.
- Under one minute. Speed to lead on the Synapsa platform, behind 1M+ buyer interactions in our platform’s operating history.11
Coming soon: The First Hour, a field guide to the demo form, after hours and the handoff.
Frequently asked questions
What did the Harvard Business Review lead response study find?
"The Short Life of Online Sales Leads" (Oldroyd, McElheran and Elkington, Harvard Business Review, March 2011) reported that most companies were not responding to online leads nearly fast enough. Summaries of it quote findings in hours, which we haven't checked against the full text. The five-minute figures come from an earlier 2007 InsideSales.com study, not from HBR.
What is lead response management?
Lead Response Management is the name InsideSales.com and James Oldroyd gave their 2007 research into when to call web leads. It studied three years of data from six companies, more than 15,000 web leads and more than 100,000 call attempts, and measured phone contact and qualification, not closed deals.
Is the five-minute rule from Harvard Business Review?
No. The five-minute comparison comes from the 2007 Lead Response Management study by InsideSales.com with James Oldroyd, then a faculty fellow at MIT. HBR published a related article by Oldroyd and colleagues in 2011, and summaries of it quote findings in hours, not minutes. Credit the five-minute figures to the 2007 study.
Which speed to lead statistics should I stop using?
Drop any figure you can't trace to a named study: "80% of sales need five or more follow-ups", "44% of reps give up after one follow-up" and "52% of leads arrive after hours" have no study behind them that we could find. Retire dated ones such as the 2012 "57% of the journey" figure, and stop quoting consumer or mortgage data as B2B.
Sources
- Clay, 2026 test in which AI agents filled in 6,346 B2B demo and contact forms. Vendor experiment; run dates not stated.
- InsideSales.com with James Oldroyd, Lead Response Management study, 2007. Six companies, three years of web-lead data; measured phone contact and qualification, not closed deals.
- 6sense, 2025 B2B buyer research (press release, Nov 2025, and report page). More than 4,000 buyers; vendor survey.
- Workato, demo-request study of 114 companies, about 2022 (page dated 2026). Small sample.
- Oldroyd, McElheran and Elkington, "The Short Life of Online Sales Leads," Harvard Business Review, March 2011.
- DesignRush, 2024, as reported by MediaPost. Website visits, not leads; no baseline stated.
- Drift, 2017 lead response secret-shopper test of 433 B2B SaaS company websites.
- Drift, 2018 lead response study of 512 B2B companies over a five-day window.
- Drift and CustomerGauge, 2020 survey of more than 100 B2B businesses. Self-reported follow-up times.
- CEB (now Gartner), 2012 buying-journey research.
- Synapsa platform data, 2026. From customer deployments.